Global Precision Agriculture Market Statistics 2026: IoT…
SOLAR TODO
Solar Energy & Infrastructure Expert Team
Watch the video
TL;DR
The 2026 precision agriculture market is roughly $20-24 billion, growing at about 11-14% annually. IoT adoption is highest on farms above 100 hectares, often reaching 35-60%, while smaller farms adopt more slowly. The strongest business cases are irrigation, weather, and soil monitoring, where payback commonly falls in the 2-5 year range and water savings can reach 15-30% or more.
Global precision agriculture spending is moving toward roughly $20-24 billion in 2026, while connected farm-device adoption exceeds 35% on many large farms. From 2021-2026, IoT uptake on 100+ hectare operations has run 2-4 times faster than on farms below 20 hectares.
Summary
Global precision agriculture spending is moving toward roughly $20-24 billion in 2026, while connected farm-device adoption is rising above 35% in large farms in several mature markets. Data from 2021-2026 shows larger farms adopt IoT 2-4 times faster than smallholders, with software, weather sensing, and variable-rate irrigation leading deployments.
Key Takeaways
- Prioritize farms above 100 hectares for first-wave IoT rollout, because large operations often show 35-60% digital adoption versus 10-25% on farms below 20 hectares.
- Use LoRaWAN or 4G field networks for 10-minute to hourly data collection, which typically supports 5-20 sensing points across 30-50 hectare blocks.
- Benchmark ROI by application: smart irrigation and soil monitoring often reach payback in 2-5 years, while AI crop imaging may take 3-6 years depending on labor cost.
- Compare regional maturity before procurement, because North America and Europe lead software penetration, while Asia-Pacific leads total installed device volume and growth above 12% CAGR.
- Match system design to farm size: 10 sensors can cover about 40 hectares in orchard frost monitoring, while 20 devices may be suitable for 50-hectare desert reclamation sites.
- Verify standards and interoperability early, including ISO 11783, IP67/IP68 field protection, and IEEE or IEC electrical compliance for gateways, power supplies, and communications hardware.
- Plan EPC scope and financing together, because turnkey deployments above $1,000K may qualify for structured financing, while 50+, 100+, and 250+ unit orders can reduce supply cost by 5%, 10%, and 15%.
- Select vendors with agronomic use-case depth, not only hardware catalogs, because weather, soil, disease, and irrigation control combined can reduce water use by up to 50% in suitable applications.
Global Precision Agriculture Market Size and 2026 Outlook
Global precision agriculture revenue is expected to reach roughly $20-24 billion in 2026, with most analyst ranges clustering around low-double-digit annual growth and software-linked IoT services outpacing machinery hardware.
According to MarketsandMarkets (2024), the precision farming market is projected to reach about $19.24 billion by 2028 at a CAGR near 12.3%, implying a 2026 market level in the mid-teen to low-$20 billion range depending on category scope. According to Grand View Research (2024), precision agriculture market estimates trend higher when software analytics, farm management platforms, and remote sensing are fully included, which is why published values vary by $3-6 billion across firms.
For procurement managers, the main point is not the exact headline number but the composition shift. Hardware remains important, yet recurring revenue from connectivity, analytics, alerts, and decision support is growing faster than standalone sensors. According to McKinsey (2022), digital agriculture tools can improve yield by 5-15% and reduce input costs by 10-20% in selected use cases when data is linked to operational decisions.
The International Energy Agency states, "Digitalization has the potential to make energy and industrial systems more connected, intelligent, efficient, reliable and sustainable." That statement applies directly to agriculture, where weather, pumping, irrigation, storage, and agronomic decisions increasingly depend on connected field data every 10-60 minutes.
| Market indicator | 2021 | 2024 | 2026 estimate | 2030 outlook |
|---|---|---|---|---|
| Global precision agriculture market value | $11-13B | $15-18B | $20-24B | $28-38B |
| Typical analyst CAGR | 10-12% | 11-14% | 11-14% | 10-13% |
| Software and analytics share | 22-28% | 28-34% | 32-38% | 38-45% |
| IoT-connected monitoring share of new projects | 18-24% | 28-35% | 35-42% | 45-55% |
These ranges combine public estimates from MarketsandMarkets, Grand View Research, Fortune Business Insights, and sector commentary from McKinsey and the World Economic Forum. The spread exists because some firms include autosteer, drones, and farm robotics, while others limit scope to sensing, analytics, and variable-rate systems.
SOLAR TODO tracks this shift closely because agricultural buyers increasingly request combined packages: weather station, soil probes, communications gateway, solar power kit, cloud monitoring, and control outputs for pumps or wind machines. In practical terms, buyers are moving from single-device procurement to site-level digital infrastructure.
IoT Adoption Rates by Farm Size and Operation Type
Large farms above 100 hectares typically adopt connected monitoring 2-4 times faster than farms below 20 hectares because they can spread gateway, cloud, and training costs across more acreage.
Farm size remains the strongest predictor of precision agriculture adoption after crop value and water stress. According to USDA ERS farm technology studies and multiple OECD country surveys, auto-guidance, yield mapping, and variable-rate tools are concentrated in larger grain and row-crop operations, while smaller farms adopt lower-cost weather and irrigation monitoring first. In horticulture, adoption can still be high on smaller land areas because crop value per hectare is higher.
A 10-hectare greenhouse or high-value orchard may justify a professional weather station faster than a 50-hectare low-margin grain plot. That is why farm size must be read together with crop economics. Apple, citrus, tea, berries, and export vegetables often support higher sensor density, sometimes 1 sensing point per 2-5 hectares, compared with 1 point per 10-20 hectares in broadacre crops.
According to the World Bank (2023), smallholder farms still account for a large share of agricultural holdings in Asia, Africa, and Latin America, which creates a two-speed market. One segment buys full-stack systems with cloud analytics and automation. The other starts with one gateway, 2-5 soil probes, and mobile alerts.
| Farm size band | Typical IoT adoption 2026 | Common first applications | Budget pattern |
|---|---|---|---|
| Under 20 ha | 10-25% | Weather alerts, soil moisture, pump control | Capex-sensitive, phased rollout |
| 20-100 ha | 20-40% | Irrigation scheduling, disease alerts, fertigation data | Mixed capex and service spend |
| 100-500 ha | 35-60% | Multi-zone monitoring, variable-rate decisions, fleet-linked data | Faster payback, multi-year plans |
| Over 500 ha | 50-75% | Integrated platforms, automation, satellite plus field sensors | Centralized procurement |
Operation type matters as much as area. Vineyards, orchards, tea estates, and protected cultivation often buy denser monitoring because frost, disease, and irrigation errors can destroy margin within 24-72 hours. Broadacre cereal farms often prioritize machinery telematics, GNSS guidance, and variable-rate application before investing in dense environmental sensing.
The Food and Agriculture Organization notes that climate variability is increasing production risk through drought, heat, and extreme weather. That raises the value of early warning systems with 10-minute intervals, especially where a 1-3 hour response window determines whether frost mitigation or irrigation action succeeds.
SOLAR TODO sees this pattern in inquiries from Latin America, the Middle East, Africa, and Southeast Asia. Buyers with 30-50 hectare orchard, tea, or reclamation projects usually ask for 10-20 devices, solar-powered nodes, LoRaWAN or 4G communications, and app-based alarms rather than isolated handheld instruments.
Regional Breakdown: Asia-Pacific, Europe, North America, Middle East and Africa, Latin America
Asia-Pacific leads global unit growth, while North America and Europe still lead in software penetration, machine connectivity, and per-farm digital spending.
Regional performance differs because farm structure, labor cost, subsidy design, water stress, and telecom coverage differ. According to IRENA (2024), renewable-powered rural infrastructure continues expanding in off-grid and weak-grid areas, which indirectly supports solar-powered agricultural IoT nodes. According to GSMA (2024), rural mobile internet coverage is improving, but adoption gaps remain large across low-income agricultural regions.
North America remains the most mature market for integrated precision agriculture in large row-crop operations. Europe shows strong adoption in environmental compliance, variable-rate input use, and weather-linked crop management. Asia-Pacific is the fastest-growing region by installed monitoring nodes, driven by China, India, Australia, Japan, and Southeast Asia. Middle East and Africa growth is tied to irrigation efficiency, protected cultivation, and desert agriculture. Latin America is strong in export crops, sugar, coffee, fruit, and large commercial farms.
| Region | 2026 market position | 2026 growth range | Main adoption driver | Typical constraints |
|---|---|---|---|---|
| Asia-Pacific | Largest by unit volume | 12-16% | Water management, scale, government programs | Fragmented farm size, training gap |
| North America | Highest digital maturity | 10-13% | Labor savings, machinery data, analytics | Integration complexity |
| Europe | High compliance-led demand | 9-12% | Input reduction, traceability, sustainability rules | High service cost |
| Middle East & Africa | Fast from low base | 11-15% | Irrigation control, desert farming, weak-grid sites | Connectivity and financing |
| Latin America | Strong commercial farm demand | 10-14% | Export crop quality, water efficiency, remote estates | FX volatility, uneven support |
According to the European Commission and national digital farming programs, subsidy-linked adoption is helping growers justify software subscriptions and sensor networks. In the United States, USDA and university extension data continue to show strong adoption of guidance and mapping tools, though full interoperability across platforms remains uneven. In India and parts of Southeast Asia, lower-cost sensor kits and mobile-first dashboards are expanding faster than high-end robotics.
The International Renewable Energy Agency states, "Renewables are powering economic growth, creating jobs, lowering energy bills and improving energy security." For agriculture, that matters because field nodes, gateways, and remote pumping sites often need autonomous solar power where grid quality is below commercial standards.
Technology Stack, Technical Benchmarks, and Data Trends 2021-2040
Precision agriculture in 2026 is defined by 10-minute to hourly data intervals, IP67/IP68 field hardware, LoRaWAN or 4G backhaul, and software layers that convert sensor data into irrigation, disease, and frost decisions.
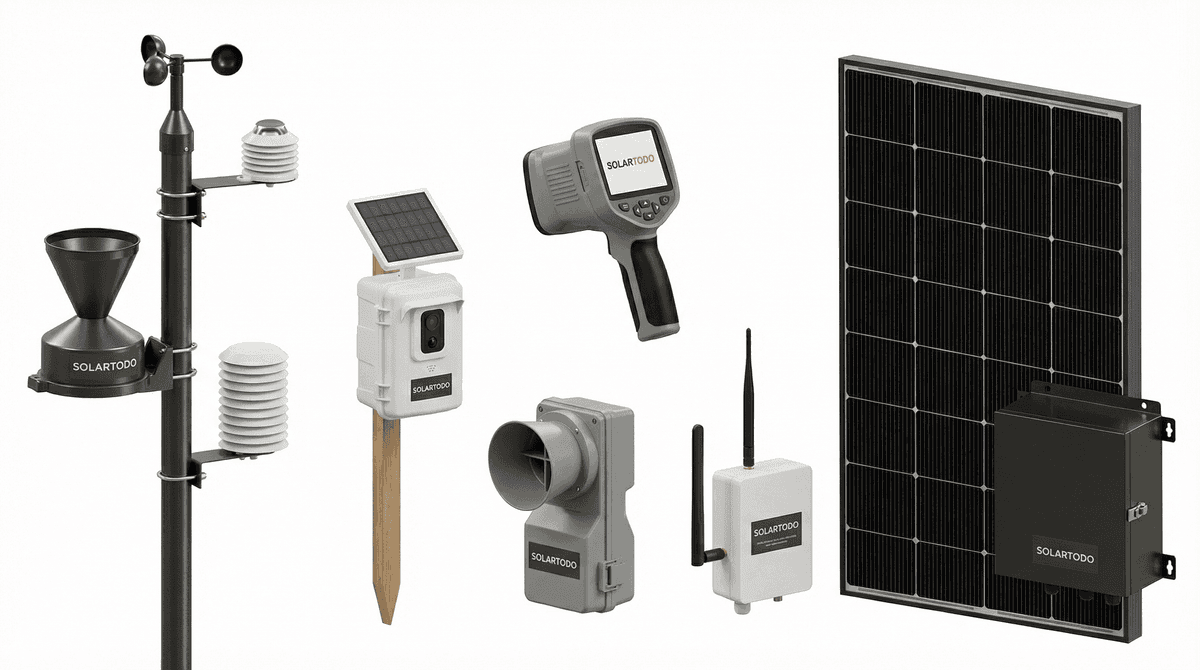
The typical stack has five layers: sensors, communications, power, cloud, and control. Sensors include weather, soil moisture, soil temperature, water quality, leaf wetness, and imaging. Communications usually use LoRaWAN for low-power field coverage up to several kilometers, or 4G LTE where telecom coverage is stable. Power is often a 20-100 W solar kit with LFP battery support for outdoor nodes. Cloud software handles alerts by SMS, email, and app push. Control outputs connect to pumps, valves, or wind machines.
From 2021 to 2026, the strongest trend has been convergence. Buyers no longer want a weather station alone. They want weather plus soil plus automation plus analytics. That is visible in SOLAR TODO solution structures such as Orchard Frost Early Warning 40ha with 10 sensing points and Tea Garden Precision Monitoring 30ha with 15 sensors/devices, both using 10-minute intervals and solar-powered outdoor operation.
Historical and forward trend analysis
The 2021-2026 period saw sensor cost decline, telecom modules improve, and cloud dashboards become standard. From 2027 to 2030, the market will likely shift toward AI-assisted recommendations, more camera data, and stronger integration with irrigation controllers and ERP systems. From 2030 to 2040, the long-term scenario is autonomous agronomic control on large farms, with machine vision, edge AI, and carbon or water accounting built into farm operations.
| Technology metric | 2021 | 2024 | 2026 | 2030 | 2040 scenario |
|---|---|---|---|---|---|
| Typical field data interval | 30-60 min | 15-30 min | 10-15 min | 5-10 min | Near-real-time on critical assets |
| Typical battery autonomy | 3-7 days | 7-15 days | 15-30 days | 30+ days | Seasonal autonomy with edge control |
| AI-supported agronomic recommendations | Under 10% | 15-20% | 20-30% | 35-50% | 60%+ on large commercial farms |
| Multi-source integration rate | 10-15% | 20-30% | 30-40% | 45-60% | 70%+ |
Technical procurement should focus on interoperability and field survivability. ISO 11783 matters for agricultural data exchange. IP67/IP68 matters for outdoor reliability. IEEE 1547 matters where distributed energy resources and control systems connect to electrical infrastructure. IEC and UL certifications matter for power supplies, batteries, and enclosures when systems are deployed in harsh environments above 45°C or in high-humidity zones.
Sample deployment scenario (illustrative): a 40-hectare orchard with 10 sensing points can detect microclimate variation earlier than manual scouting, while a 50-hectare desert reclamation site with 20 sensors and 500 kW solar support can combine water, energy, and agronomic monitoring in one platform. Those architectures are increasingly relevant where evapotranspiration exceeds 5-10 mm/day.
EPC Investment Analysis and Pricing Structure
Precision agriculture EPC projects typically bundle sensors, gateways, solar power kits, cloud setup, commissioning, and operator training, with payback often falling in the 2-5 year range for irrigation-led use cases.
For B2B buyers, EPC means Engineering, Procurement, and Construction or turnkey delivery. In this category, that usually includes site survey, bill of materials, communications design, solar power sizing, mounting hardware, gateway configuration, cloud onboarding, alarm setup, and commissioning tests. For larger projects, it may also include SCADA or pump-controller integration, civil works for poles or cabinets, and staff training over 1-3 sessions.
SOLAR TODO generally discusses three commercial structures with buyers:
| Commercial model | What is included | Typical buyer use |
|---|---|---|
| FOB Supply | Hardware only, factory delivery terms | Importers, distributors, EPC firms |
| CIF Delivered | Hardware plus freight and destination delivery scope | Buyers needing landed-cost clarity |
| EPC Turnkey | Supply, installation guidance or execution, commissioning, training | Farms, estates, public projects |
Volume pricing guidance for standard device quantities is commonly structured as follows:
| Order volume | Indicative discount |
|---|---|
| 50+ units | 5% |
| 100+ units | 10% |
| 250+ units | 15% |
Payment terms commonly used are 30% T/T plus 70% against B/L, or 100% L/C at sight. Financing may be available for large projects above $1,000K, especially when the scope includes solar power, pumping, or multi-site agricultural infrastructure. For pricing, EPC discussions, or warranty scope, buyers can contact [email protected].
ROI depends on crop, labor, and water cost. Smart irrigation and soil monitoring often save 15-30% water and reduce field visits by 20-40%. In higher-stress applications, such as desert reclamation, integrated monitoring with automated drip control can reduce irrigation water use by up to 50% and pesticide use by about 30% when agronomic protocols are followed.
| Application | Typical savings impact | Indicative payback |
|---|---|---|
| Soil moisture + irrigation control | 15-30% water savings | 2-4 years |
| Frost early warning + active control | Loss avoidance on sensitive bloom stages | 2-5 years |
| Disease monitoring + imaging | Faster intervention, lower spray waste | 3-6 years |
| Multi-parameter weather + farm dashboard | Labor and decision efficiency gains | 2-5 years |
Use Cases and Vendor Selection Criteria for B2B Buyers
The best precision agriculture systems in 2026 are selected by crop risk, hectare coverage, communication method, and control requirements, not by sensor count alone.
Procurement teams should first define the agronomic problem in numbers. If frost can cause 20-90% blossom loss in severe events, then temperature, humidity, wind, and alert latency matter more than generic dashboard features. If water cost or scarcity is the main issue, then soil moisture depth, evapotranspiration, valve control, and pump telemetry should drive the specification.
For orchard operations, a 40-hectare frost warning system with 10 field sensing points and wind machine control is suitable when microclimate variation exists across 2-4 adjacent zones. For tea estates, a 30-hectare package with 15 sensors/devices and one multispectral leaf scanner is more aligned with disease pressure and slope-related moisture variation. For desert agriculture, 50-hectare systems with 20 sensors, 4G LTE, water-quality tracking, and drip control are often justified where grid power is unstable.
Vendor comparison should include seven checkpoints:
- Coverage per gateway, such as 30-50 hectares under LoRaWAN field conditions
- Sensor protection rating, preferably IP67 or IP68 for exposed deployment
- Data interval, typically 10-15 minutes for operational use
- Power autonomy, including solar charging and LFP battery sizing
- Interoperability, including ISO 11783 or API export capability
- Alarm methods, such as SMS, email, and app push within minutes
- Warranty and service scope, commonly 1-2 years for hardware and 1 year for cloud tiers
SOLAR TODO is relevant when buyers need combined solar power and agricultural monitoring rather than a software-only subscription. That matters in Latin America, the Middle East, Africa, and Southeast Asia, where remote fields may need autonomous power, long-range communication, and offline quotation support for project procurement.
FAQ
Precision agriculture buyers most often ask about market size, farm-size fit, ROI, communications, and EPC scope, with 2026 decisions increasingly centered on interoperability and measurable water or labor savings.
Q: What is the global precision agriculture market size in 2026? A: Most public estimates place the 2026 precision agriculture market around $20-24 billion, depending on whether machinery automation, software, and remote sensing are fully included. Growth is generally cited near 11-14% CAGR, with software and analytics rising faster than standalone hardware.
Q: How does farm size affect IoT adoption in agriculture? A: Farm size strongly affects adoption because gateway, cloud, and training costs scale better on larger acreage. In 2026, farms above 100 hectares often show 35-60% connected-tool adoption, while farms under 20 hectares are more commonly in the 10-25% range unless they grow high-value crops.
Q: Which regions lead precision agriculture adoption in 2026? A: Asia-Pacific leads by installed unit volume and growth, while North America and Europe lead in digital maturity and software use. Middle East and Africa are growing quickly in irrigation-led projects, and Latin America remains strong in export crops, large estates, and remote farm monitoring.
Q: What technologies are most commonly deployed first? A: Weather stations, soil moisture probes, irrigation control, and mobile alerts are usually the first purchases because they solve immediate operational problems. Typical systems collect data every 10-60 minutes and use LoRaWAN or 4G LTE, with IP67/IP68 field hardware for outdoor reliability.
Q: What payback period should buyers expect from precision agriculture systems? A: Many irrigation and monitoring projects reach payback in 2-5 years, especially where water cost, labor cost, or crop value is high. Disease imaging and advanced analytics can take 3-6 years, but loss prevention in frost-sensitive orchards may justify investment faster during one severe season.
Q: Why are solar-powered nodes important for agricultural IoT? A: Solar-powered nodes reduce dependence on unstable rural grids and lower trenching or cabling cost across 30-50 hectare sites. They are especially useful where gateways, pumps, or sensing points are distributed, and where outages would otherwise interrupt 10-minute monitoring intervals.
Q: What standards and certifications should procurement teams check? A: Buyers should check ISO 11783 for agricultural data interoperability, IP67/IP68 for enclosure protection, and relevant IEC, UL, or IEEE electrical compliance for power and communications equipment. These checks reduce integration risk and improve long-term field reliability in heat, humidity, and dust.
Q: What does an EPC turnkey precision agriculture project include? A: EPC turnkey scope usually includes engineering, procurement, hardware supply, communications design, solar power sizing, commissioning, and operator training. Larger projects may also include valve or pump control integration, control cabinets, civil works, and cloud platform setup with 1 year of service.
Q: How are FOB, CIF, and EPC pricing structures different? A: FOB Supply covers hardware at factory terms, CIF Delivered adds freight and destination delivery scope, and EPC Turnkey adds implementation and commissioning services. Standard volume guidance often starts at 5% discount for 50+ units, 10% for 100+, and 15% for 250+ units.
Q: What payment terms and financing options are common? A: Common terms are 30% T/T in advance and 70% against B/L, or 100% L/C at sight for qualified transactions. Financing may be available for projects above $1,000K, especially when agricultural monitoring is bundled with solar energy, pumping, or wider infrastructure scope.
References
According to the sources below, 2026 precision agriculture growth is being driven by software, sensing, connectivity, and water-efficiency use cases across both large commercial farms and high-value smaller holdings.
- IEA (2024): World Energy Outlook and digitalization commentary relevant to connected infrastructure, electrification, and efficiency.
- IRENA (2024): Renewable Capacity Statistics and rural energy context supporting solar-powered field infrastructure.
- FAO (2023): Climate risk, water stress, and agricultural resilience data relevant to precision monitoring adoption.
- USDA ERS (2023): Farm technology adoption studies covering guidance, mapping, and precision agriculture use by farm size.
- GSMA (2024): Mobile internet connectivity and rural coverage data affecting agricultural IoT deployment.
- MarketsandMarkets (2024): Precision farming market forecast with revenue and CAGR estimates through 2028.
- McKinsey & Company (2022): Digital agriculture value creation estimates for yield, input reduction, and operational efficiency.
- ISO 11783 (current edition): Standard for communication and data exchange in agricultural and forestry machinery systems.
About SOLARTODO
SOLARTODO is a global integrated solution provider specializing in solar power generation systems, energy-storage products, smart street-lighting and solar street-lighting, intelligent security & IoT linkage systems, power transmission towers, telecom communication towers, and smart-agriculture solutions for worldwide B2B customers.
About the Author

SOLAR TODO
Solar Energy & Infrastructure Expert Team
SOLAR TODO is a professional supplier of solar energy, energy storage, smart lighting, smart agriculture, security systems, communication towers, and power tower equipment.
Our technical team has over 15 years of experience in renewable energy and infrastructure, providing high-quality products and solutions to B2B customers worldwide.
Expertise: PV system design, energy storage optimization, smart lighting integration, smart agriculture monitoring, security system integration, communication and power tower supply.
Cite This Article
SOLAR TODO. (2026). Global Precision Agriculture Market Statistics 2026: IoT…. SOLAR TODO. Retrieved from https://solartodo.com/knowledge/global-precision-agriculture-market-statistics-2026-iot-adoption-farm-size-data
@article{solartodo_global_precision_agriculture_market_statistics_2026_iot_adoption_farm_size_data,
  title = {Global Precision Agriculture Market Statistics 2026: IoT…},
  author = {SOLAR TODO},
  journal = {SOLAR TODO Knowledge Base},
  year = {2026},
  url = {https://solartodo.com/knowledge/global-precision-agriculture-market-statistics-2026-iot-adoption-farm-size-data},
  note = {Accessed: 2026-05-06}
}
Published: May 6, 2026 | Available at: https://solartodo.com/knowledge/global-precision-agriculture-market-statistics-2026-iot-adoption-farm-size-data
Subscribe to Our Newsletter
Get the latest solar energy news and insights delivered to your inbox.
View All Articles